Powered by Average True Range measurements in THREE timeframes Reveals when to expect ‘algo attacks’ using their own tactics File size: 10.5 MB
Simpler Trading – Top Hat Indicator
Top Hat Features:
Powered by Average True Range measurements in THREE timeframes
Reveals when to expect ‘algo attacks’ using their own tactics
Use on intraday or daily charts to anticipate ‘sudden’ reversals Now available for Thinkorswim and Tradestation
Reversion to the mean is one of the quintessential parts of trading. What does that mean? What goes way up must come down, and what goes way down must come up.
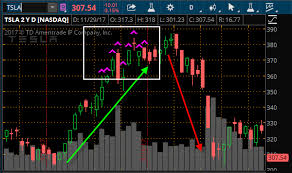
That was the concept that inspired the Top Hat Indicator. Top Hat is designed to show a signal on the charts when a stock has gotten too hot or too cold and the probability of “mean reversion†or, more simply, a move in the opposite direction is most likely.
All financial instruments have a personality to them that can, in a way, be measured by average true range. For example, a stock like Pfizer will move significantly less day-to-day than a comparably priced one like Intel. Understanding the personality of a stock and the concept of mean reversion drives the Top Hat indicator.
We like to use this indicator as an early indicator of a swing up or down pushing the limits of the typical move which usually precedes a reversal in the opposite direction.
How Do We Use It?
We use the Top Hat indicator to understand when a stock is getting statistically overheated or overly sold.
Top Hat works on the premise of Average True Range, but the underlying calculation of the indicator is much more nuanced. Behind the scenes Top Hat is scanning the ATRs of three different timeframes to minimize noise and maximize the effect of the signals it provides.
By automatically scanning these three timeframes all at once and only showing a signal when all three are aligned the Top Hat indicator is an early warning that the trend may be reversing after reaching statistically significant turning points.
Download immediately Simpler Trading – Top Hat Indicator now

")
")


")


![[Download] Leon Castillo – Selfmastered Evolution 3.0 (2022)](https://thecoursearena.com/wp-content/uploads/2023/11/Leon-Castillo-–-Selfmastered-Evolution-3.0-1-300x300.png "[Download] Leon Castillo – Selfmastered Evolution 3.0 (2022)")


![[Download] Dain Walker – Instagrowth Academy (2021)](https://thecoursearena.com/wp-content/uploads/2023/11/Dain-Walker-300x300.jpg "[Download] Dain Walker – Instagrowth Academy (2021)")


")


![[Download] The Selling Family – Amazon Boot Camp V4.0 (2021)](https://thecoursearena.com/wp-content/uploads/2023/11/fire-1-11-2-300x300.jpg "[Download] The Selling Family – Amazon Boot Camp V4.0 (2021)")
