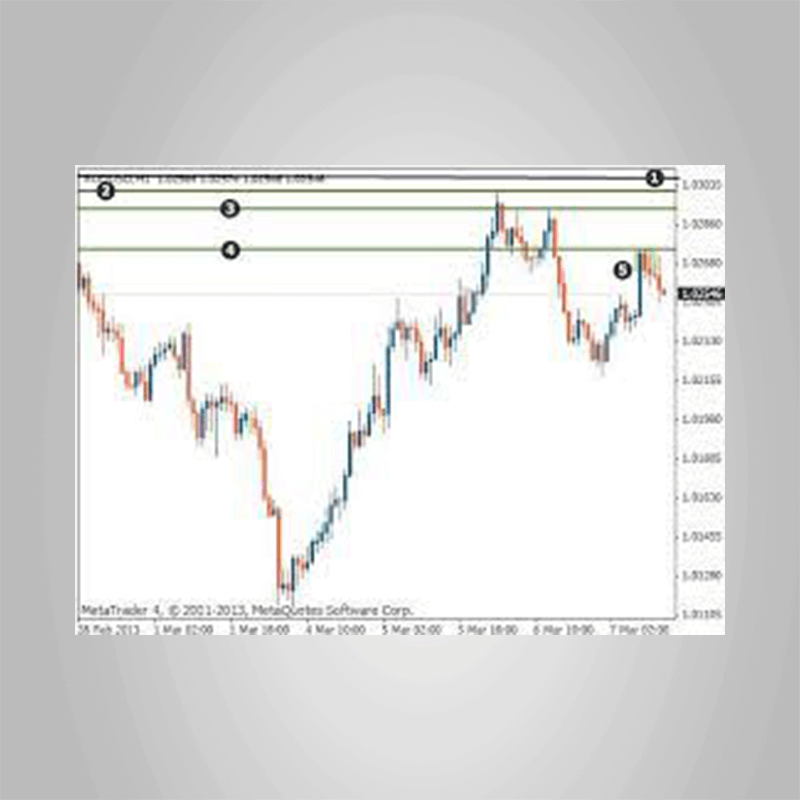
Tredimo – Support and Resistance TradingTrading support and resistanceFind resistance levelsOpen your chart and find the highest price level.Now place a line on the chart and move it down the first resistance level that you find:Line drawn at top of chart that you will move down.Price level that you will move the line down to.The green shaded area is identifies the first resistance level.Place a second line on the chart and move it down, below the current line you already have on the chart, until you find the next resistance level as the following chart shows:Line drawn at the top of the chart that you will move down.The first resistance line that you have drawn.Price level where you will move your line down to.The green shaded area highlights the second resistance level.Continue to place resistance levels on your chart until you reach the current market price.You do not want to put too many resistance levels on your chart – just the most important ones:Line drawn at the top of the chart that you will move down.First resistance line.Second resistance line.Price level you have moved the line down to.The green shaded area shows the third resistance level.Work your way up from the bottom and place support levelsPlace a line on the chart and move it up to the first support level that you find:Line drawn at the bottom of the chart that you will move up.First support level where the line has been moved up to.Red shaded area shows the first support level.Place another line on the chart and move it up to the next support level:New line drawn that you will move up.First support lineSecond support level where you move the new line to.Red shaded area shows the second support level.Continue to place support levels until you reach the current market price. You do not want to place too many support levels on the chart, but rather try to pick the most significant support levels.New line at the bottom that you will move up to a new resistance level.First support line.Second support line.Third support level that you will move the line to.and 6. Red shaded areas show the third support level.Once you have finished, you now have a price chart with a number of support and resistance levels that will look something similar to the chart above.Now continue on to the next lesson to learn the first method of trading with support and resistance levels.
Trading – Forex – Cryptos – Stocks
Tredimo – Support and Resistance Trading
Related products
-
 Trading – Forex – Cryptos – Stocks
Optionpit – Maximizing Profits with Weekly Options
₹4,814 Add to cart -
 Trading – Forex – Cryptos – Stocks
Orderflows – Orderflows Inner Circle Video Club Access
₹3,320 Add to cart -
 Trading – Forex – Cryptos – Stocks
Myfxsource – Pete’s Scalping Strategy Video Course
₹2,158 Add to cart -

")


